It’s been said that personal trainers receive the majority of information from muscle magazines. What’s frightening is that they blindly apply this new-found (sometimes quite inaccurate) knowledge with themselves, or worse, their clients. Remember, don’t believe everything you read … sometimes a little knowledge can be very dangerous! Well, it’s about time as trainers that you at least start reviewing the references listed at the end of articles. There’s much to learn from these often-overlooked sources. And if there are none listed, then you must question its validity. It may take me just minutes to read an article, but hours to go through the references! Here are some nuggets of information that you may find useful:
Calf muscle strength in humans.
Trappe SW, Trappe TA, Lee GA, Costill DL.
Int J Sports Med 2001 Apr;22(3):186-91
PURPOSE: In an effort to measure strength characteristics of the calf muscles, 18 subjects (14 male, 4 female, age =34.3+/-2.4yrs) were tested using a specially designed torque velocity device (TVD). This TVD is a hardware interface with the subject’s lower leg which stabilizes the leg for calf muscle strength measurements.
METHODS: Calf muscle strength measurements consisted of 1) isometric force production at ankle angles of 80, 90, and 100 degrees of plantar flexion, 2) peak torque at six isokinetic angular velocities 0.52, 1.05, 2.09, 3.14, 4.19, and 5.24 rad x s(-1), and 3) a fatigue test consisting of 30 maximal contractions at 3.14 rad x s(-1). The greatest force production occurred at 80 degrees of ankle plantar flexion (148.5 +/- 40.2 Nm). Isokinetic force production ranged from 114.1 +/- 24.7 Nm at 0.52 rad x s(-1) to 16.8 +/- 6.5 Nm at 5.24 rad x s(-1). A fatigue test consisting of 30 maximal repetitions at 3.14 rad x s(-1) resulted in a 61 +/- 15% decline in force production. To assess reproducibility and day to day variation, measurements at 1.05 and 2.09 rad x s(-1) were made during five different trials in a single day and one trial per day for three days, respectively. The within subject coefficient of variation was 2.6 to 6.5% for reproducibility and 1.9 to 7.4% for day to day variation. Magnetic resonance imaging (MRI) of the lower limb and muscle biopsy specimens from the gastrocnemius (lateral head) and soleus muscles were obtained to examine the relationship between strength and morphological characteristics of the calf muscles.
RESULTS: Cross-sectional area of the primary plantar flexors (gastrocnemius and soleus) was 47.9 +/- 1.3 cm2 while muscle volume was 642 +/- 16 cm3. Muscle fiber composition of the gastrocnemius and soleus averaged 57 +/- 2 and 85 +/- 3% type I fibers, respectively. A poor correlation was found between fiber type and maximal isometric force production (r =0.38; p>0.05). However, calf muscle strength and muscle size was positively correlated (r = 0.76; p < 0.05).
CONCLUSIONS: These data indicate that using the TVD interface to stabilize the lower leg is a reliable and reproducible procedure for the measurement of calf muscle strength.
Table 1 – Fiber type, fiber area, and muscle size (muscle cross-sectional area [CSA] and muscle volume; determined from MRI) of the gastrocnemius and soleus muscles. (Trappe et al., 2001)
| Variable | Gastrocnemius | Soleus | Gast. + Soleus |
| Fiber Type(%) | |||
| Type I | 57.2+/-2.4 | 84.7+/-2.5 | |
| Type IIa | 31.3+/-2.4 | 16.3+/-2.4 | |
| Type IIb | 11.5+/-1.1 | ||
| Fiber Area (µm2) | |||
| Type I | 5460+/-508 | 7800+/-910 | |
| Type II | 5831+/-789 | 8323+/-959 | |
| CSA (cm2) | 23.8+/-0.4 | 24.2+/-1.1 | 47.9+/-1.3 |
| Muscle Vol. (cm2) | 265+/-7 | 377+/-12 | 642+/-16 |
This study reveals that the soleus is comprised of primarily type I fibers and the max. torque of gastrocnemius occurs at a knee angle of 160º.
The effects of eccentric velocity on activation of elbow flexors: evaluation by magnetic resonance imaging.
Kulig K, Powers CM, Shellock FG, Terk M.
Med Sci Sports Exerc 2001 Feb;33(2):196-200
PURPOSE: To compare magnetic resonance imaging (MRI) signal intensity changes in the primary elbow flexors during two isotonic exercise protocols varying in eccentric velocity and the ratio of eccentric to concentric activity.
METHODS: Twelve men performed two exercise protocols. The right and left arms were randomly assigned to one of two protocols that had the same workload (60% 1RM) and same total time of exercise (144 s) but differed in the velocity and ratio of eccentric to concentric activity (1:1 and 5:1 for the fast and slow protocols, respectively). MRI signal intensity changes were quantified pre- and post-exercises using an inversion recovery sequence with a 1.5T MRI system (TR = 2500 ms, TE = 90 ms, TI = 140 ms). Percent change in MRI signal intensity, rate of perceived exertion (RPE), and delayed onset muscle soreness (DOMS) were recorded and analyzed.
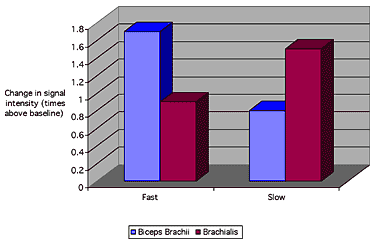
RESULTS: The biceps brachii was found to be preferentially recruited during the fast protocol compared with the brachialis, whereas the brachialis was found to be preferentially recruited during the slow protocol (P < 0.05). The fast exercise protocol was perceived as being more strenuous (RPE = 8.3 +/- 2.1) than the slow (RPE = 5.4 +/- 1.5, P < 0.05) and produced DOMS in 58% of the tested subjects.
CONCLUSIONS: These results suggest that agonists respond to various loading conditions

Figure 1 – Change in signal intensity of biceps brachii and brachialis during fast and slow exercise protocols. (Kulig et al., 2000)
This study indicates that velocity can alter recruitment patterns during an arm curl.
For more information on these topics, read my article Pop ‘Em Out Muscles… and don’t forget to check the references!

Stretching Smarter: The Do’s and Don’ts for Maximum Flexibility
By JP CatanzaroOriginally published: September 23, 2014 – Updated for 2025 Want to boost flexibility, prevent injuries, and optimize performance?

Training Economy: How Weight Training Can Be Your All-in-One Fitness Solution
Recent research has once again confirmed what many in the weightlifting community already know: weight training isn’t just for building

4 Invaluable Lessons from Strength Training Pioneer Arthur Jones
Arthur Jones, a true visionary in the realm of strength training, left an unforgettable mark on the fitness industry with
follow
Error: No feed with the ID 2 found.
Please go to the Instagram Feed settings page to create a feed.
